


Skip to content
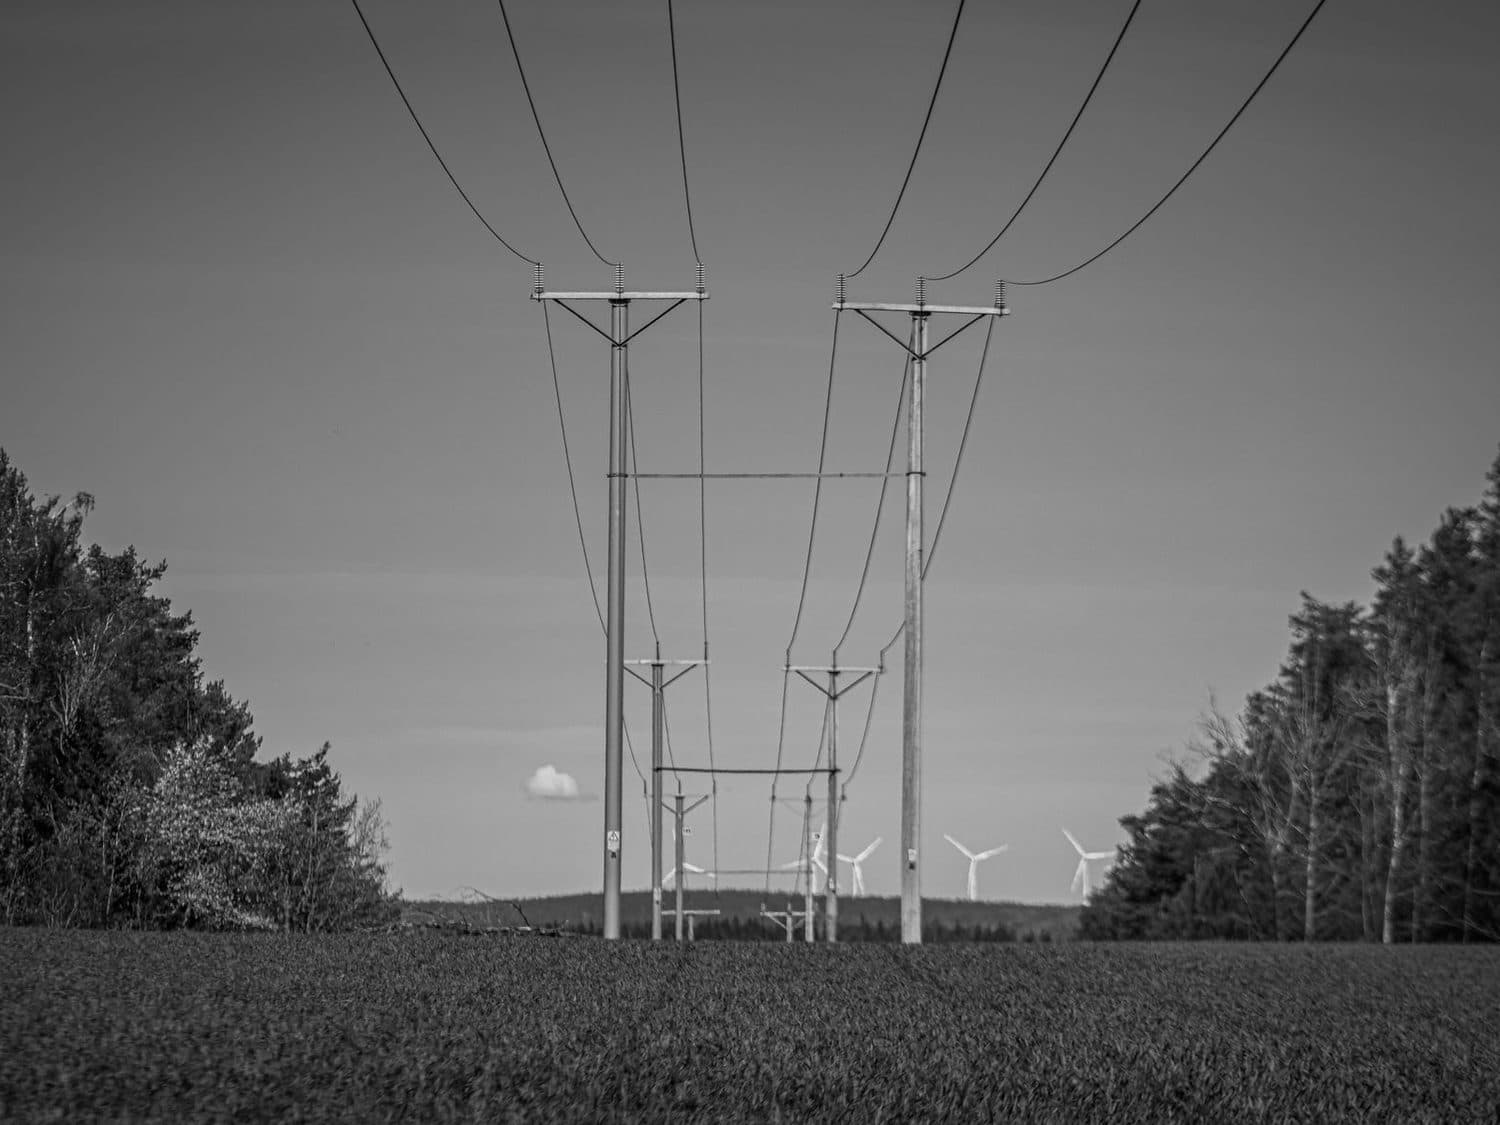
Transmission lines crossing a field, wind turbines beyond

Article · 30 July 2026 · Transition · Detego Research

Capital spending ahead of the energy mix

BRSR reports environmental capital spending and renewable share of energy separately. Across three large filers over three years, the two move in opposite directions.

What the numbers show

Environmental capital spending
70.8%
FY2025-26, from 45.8% in FY2023-24
Renewable share, same filer
1.1%
Down from 1.5% over the same period
Renewable share elsewhere
97.9%
At a filer cutting its environmental spending
Renewable range, one sector
1.3–86.9%
Twenty automobile makers, median 21.4%

Transition

BRSR asks what share of capital spending went to technologies that improve resource efficiency or cut environmental impact, and separately what share of energy came from renewable sources. Both are read as signs of transition effort, and they can point opposite ways.

An oil and gas filer raised the environmental share of its capital spending from 45.8 per cent in FY2023-24 to 63.4 per cent in FY2024-25 and 70.8 per cent in FY2025-26. Over the same three years the renewable share of its energy fell from 1.5 to 1.1 per cent. The reported spending increase does not coincide with a higher renewable energy share. These fields alone do not establish when projects were completed or how they affected energy use.

A consumer goods filer shows the reverse. Its energy reached 97.9 per cent renewable in FY2025-26, rising in each of the three years, while its environmental capital spending fell from 25 to 15.2 per cent of the total. Lower spending alongside a higher renewable share could reflect earlier investment, but the two figures alone do not establish the cause. Reading the spending measure on its own would miss the energy outcome.

Taken across a whole sector rather than three filers, the renewable share separates very little on its own. Twenty listed automobile and component makers report between 1.3 and 86.9 per cent renewable energy for FY2024-25, around a median of 21.4 per cent. Differences in operations, location, energy procurement and reporting boundaries may all affect this comparison. These need to be examined before attributing the spread to company strategy.

Get in touch

Let’s move your next initiative forward.

Tell us what your team needs to achieve across ESG, HR, supply chain or other business data. We will help define the right data, analytical support or software for the work.

contact@detegosolutions.com